 |
|||
|
|
|||
|
Page Title:
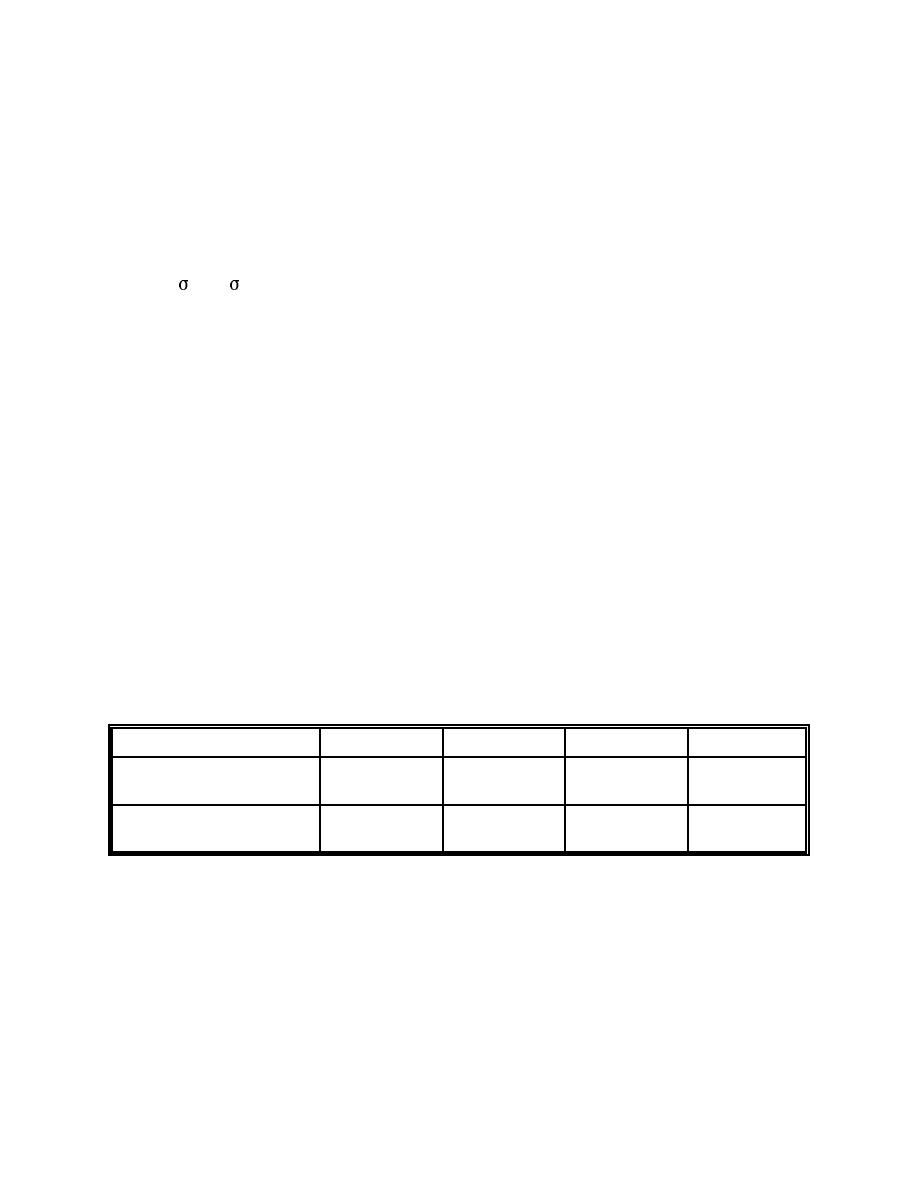
Table 7-1. Site Boundary Doses Associated with Release |
|
||
| ||||||||||
|
|  DOE-HDBK-3010-94
7.0 Application Examples; Introductory Material
boundary distance for the mock operation is 2 km, and any respirable release would be
anticipated to be an oxide by the time it traversed such a distance through air.
The dose measures used in the calculation are as presented in Table 7-1 below. At 2 km, the
values of y and z are ~ 63 and 19 respectively for limiting F at 1 m/sec windspeed
conditions, and a conservative breathing rate is 3.3E-4 m3/sec. Using these values indicates,
for example, that a source term of 0.9 Ci of Pu-239, or ~ 14.5 g, produces a dose of 25
rem to a maximally exposed person at the site boundary (i.e., individual there for duration of
plume passage with no protection). Use of one of the Gaussian plume model computer codes
currently in use in the DOE complex provided an estimate of 1 Ci release to obtain a dose of
25 rem, thus confirming the general appropriateness of the hand calculation. This code also
indicated that if particulate deposition was accounted for, using a typical velocity of 1 m/sec,
the release needed to achieve a 25 rem dose at the site boundary increased by a factor of 5.
Table 7-1 lists releases external to the building and their resulting site boundary doses in
terms of 50-year committed effective dose equivalent, both with and without deposition. If
building leakpath factors are taken into account, the initial source term producing these
releases would be orders of magnitude greater if airflow passed through HEPA filtration.
Even if ventilation fails and the building is in a relatively undamaged static condition, it
would not be unusual for the required initial source term for a given site boundary dose to be
at least an order of magnitude greater due to building deposition alone. The examples in this
handbook provide initial source terms at the point of generation only, which would equate to
the values in Table 7-1 for a completely unmitigated case.
Table 7-1. Site Boundary Doses Associated with Release
Case
100 rem
25 rem
5 rem
1 rem
1. No deposition
3.6 Ci
0.9 Ci
0.2 Ci
0.04 Ci
(58 g)
(14.5 g)
(2.9 g)
(0.6 g)
2. Deposition
18 Ci
4.5 Ci
0.9 Ci
0.2 Ci
(290 g)
(73 g)
(14.5 g)
(2.9 g)
As noted in the discussion of release models, neither set of values in Table 7-1 is inherently
meaningful. Each merely provides a perspective that may be useful under certain
circumstances. Either model is only as good as the decisions it leads to. If a model leads to
obviously inappropriate conclusions or actions, there is no reason to accord the model any
credence. This point is further amplified by the examples.
Page 7-4
|
|
Privacy Statement - Press Release - Copyright Information. - Contact Us |
