 |
|||
|
|
|||
|
Page Title:
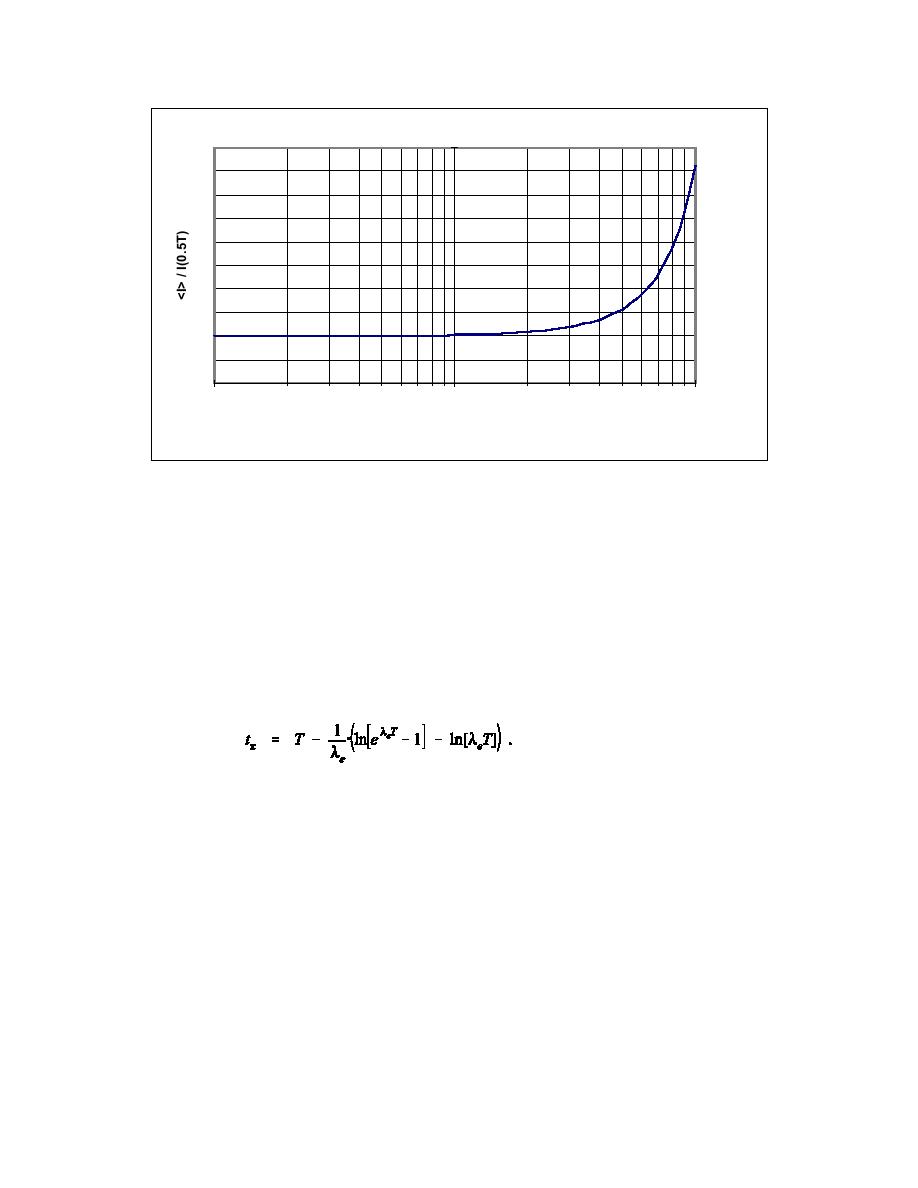
Figure 5. Expectation Value of Intake Divided by Intake at T/2 for a Single Exponential |
|
||
| ||||||||||
|
|  DOE-STD-1121-98
5
4
(18)
3
2
1
0
0.1
1
10
Tim e Betw een Bioassay Measurem ents, T (units of T1/2)
Figure 5. Expectation Value of Intake Divided by Intake at T/2 for a Single Exponential
Retention Function
The ratio in Eq. (17) is plotted in Figure 5. Clearly, the expectation value of the intake, <I>, given
bioassay result X and a uniform probability of intake throughout the interval between bioassay
measurements, is greater than the value of the intake calculated at the expectation value of the intake time,
<ti>.
There exists a time, tx, (0 # tx # T), such that an intake of <I> at tx would yield bioassay result X at
time T. This time is
(19)
A plot of tx (T/2) as given in Eq 19 is shown in Figure 7. Clearly, tx occurs earlier in time than T/2, and
an intake calculated at T/2 underestimates the expectation value of the intake over the range of 0 to T.
What value, then, <ti> or tx, should be used for computing DILs and DRLs? The time of the
expectation value of intake is what we're concerned with, not the expectation value of intake time.
Therefore, tx is the correct value. Use of T/2 rather than tx for calculating the DIL will result in a DIL that
is too high, depending on the nature of the intake retention function and the length of time between
bioassay measurements.
76
|
|
Privacy Statement - Press Release - Copyright Information. - Contact Us |