 |
|||
|
|
|||
|
Page Title:
Table 3-7. Statistical Sum m ary of Drop Size Param eters for Lognorm al Distributions |
|
||
| ||||||||||
|
|  DOE-HDBK-3010-94
3.0 Liquids; Aqueous Solutions
This correlation covers all of the spill data, including slurries and viscous solutions. This
results in it being potentially nonconservative for low-density aqueous solutions modelled on
the uranine data. In order to determine a bounding ARF for this subset of solutions, the
ARF value calculated from the model are multiplied by a factor of 3 (empirical observation).
This factor does not apply to the other types of solutions.
No regression analysis produced a satisfactory correlation with AMMD and a simple
statistical correlation representation of lognormal drop size parameters is substituted. They
are presented in Table 3-7.
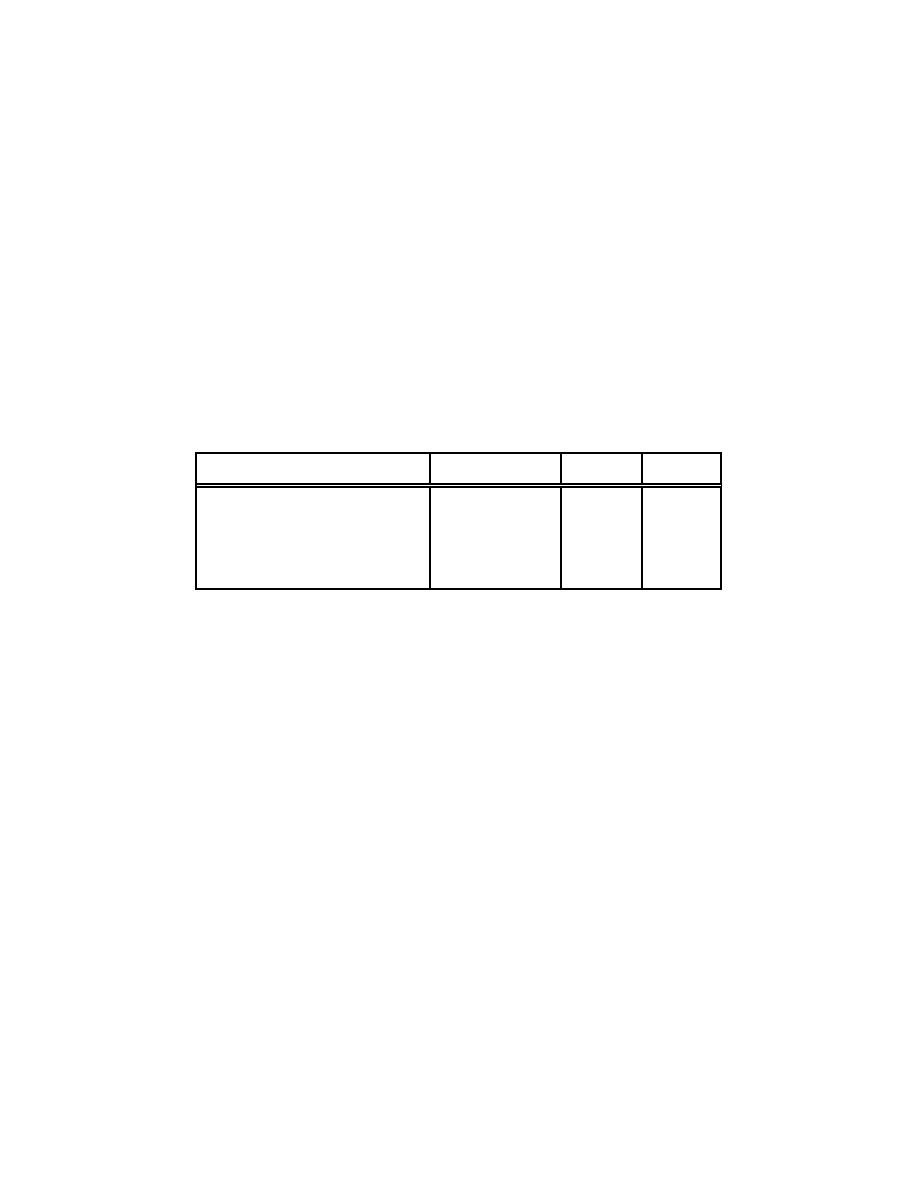
Table 3-7. Statistical Sum m ary of Drop Size Param eters for Lognorm al Distributions
(Table 3.4 - Ballinger, et al., January 1988)
AM M D, m
GSDa
RF
All data
21.5
7.3
0.4
UNH spill
27.2
6.0
0.3
Uranine Spill
27.1
3.0
0.2
Sucrose spill
12.5
12.3
0.5
Slurry spill
15.8
10.1
0.4
a
GSD = Geometric Standard Deviation.
The values listed in Table 3-7 should be applied to the appropriate liquids assumed involved
in the event. For example, if the liquid can not be specified, the values assumed for all data
would apply. The UNH represents heavy metal, aqueous solutions with densities 1.2 g/cm3
or greater. For other aqueous solutions, the uranine values apply. The sucrose values are
applicable to liquid with viscosities greater than 50 centipoise (the ARF decreases with
viscosity but the AMAD appears to remain relatively constant for the limited data set
available). Slurry values are applied to aqueous slurries.
3.2.3.2
S lu rries
Experiments have been performed to measure the ARF and RF from the free-fall spill of
slurries (Ballinger and Hodgson, December 1986). The apparatus (see Figure A.7,
Appendix A) and procedures were as used in the free-fall spill experiments involving aqueous
solutions. The pertinent data extracted from the reference document (Ballinger and Hodgson,
December 1986) are shown in Table 3-8 (original data tables reproduced as Tables A.14 and
A.15 in Appendix A). The bounding ARF and RF values are 5E-5 and 0.8 with median and
average values of 2E-5 and 0.7 and 2E-5 and 0.8, respectively. The empirical model for
calculation of ARFs and drop size characteristics was discussed in subsection 3.2.3.1.
Page 3-35
|
|
Privacy Statement - Press Release - Copyright Information. - Contact Us |
