 |
|||
|
|
|||
|
Page Title:
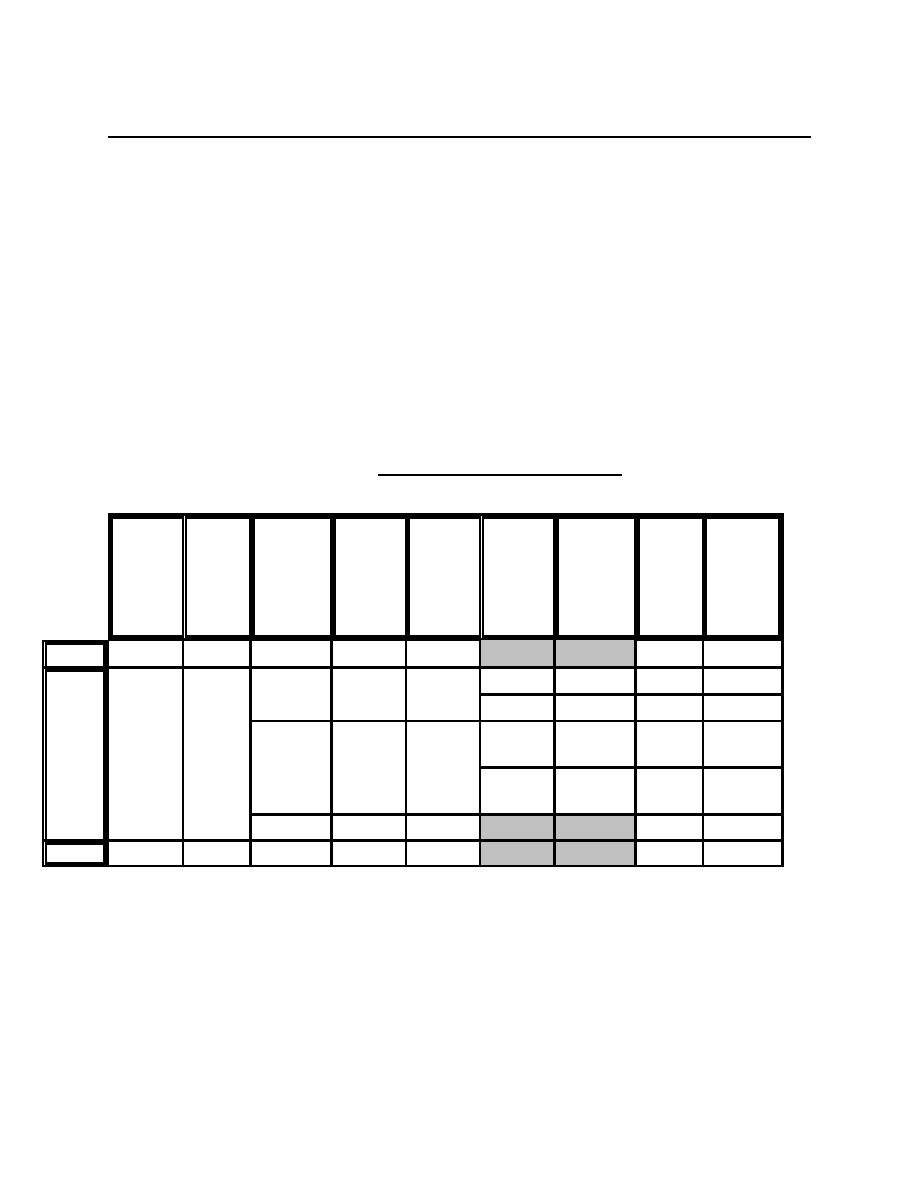
Table B-20. Information from the local airports. |
|
||
| ||||||||||
|
|  DOE-STD-3014-96
APPENDIX B
For this sample problem, the analyst should obtain information from the three nearby
airfields. The results are provided in Table B-20.
During the interview, the analyst determined that Airport 2 has a pattern side to the
west of the runway. Also, a helicopter flies around the facility once a day to perform
surveillance.
Once the information is accumulated, the data should be organized by filling out
Table B-21 for each runway. Tables B-22 through B-27 show how Table B-21 would
be filled out for this example.
TABLE B-20. Information from the local airports.
Number of
Runway
Aircraft
Operations
Can the
Sub-
Operations
Preferred
Percentage of
Airstrips at
Numbers
Categories
Per Year
Operations
Categories
Per Year for
Runway
Operations on
Airport
that Use the
be Broken
Each Sub-
Preferred
Airport
Down into
Category
Runway
Sub-
Categories
Airport 1
1
10, 28
GA
2,000
No
10
75
Airport 2
1
0, 18
Commercial
60,000
Yes
Air Carrier
46,000
18
56
Air Taxi
14,000
18
56
Military
120,000
Yes
Large
100,000
18
56
Military
Small
20,000
18
56
Military
GA
20,000
No
18
56
Airport 3
1
4, 22
GA
6,000
No
22
85
B-32
|
|
Privacy Statement - Press Release - Copyright Information. - Contact Us |