 |
|||
|
|
|||
|
|
|||
| ||||||||||
|
|  DOE-STD-3013-2004
some alternate methods of estimating the density to be used in the equation must be
developed.
B.3.2.2
Packing Fraction Method
Any powder poured into a container has a bulk density less than the particle density for the
material. Measurements of particle density by gas pycnometer and comparison with bulk density
have shown that the packing fraction, which is the ratio of bulk density to particle density,
varies over a fairly wide range, but does not exceed 0.62 [Mason et al. 1999]. Thus, one
approach would be to determine the bulk density and divide by 0.62, realizing that the true
particle density can be no less than this value (a higher value would result in a smaller volume
occupied by the particles and, hence, a lower theoretical gas pressure). Consequently, if 3.6 kg
of oxide filled a 1.8 l convenience container, the bulk density would be 2.0 kg/l and the
estimated particle density would be 2.0/0.62, or 3.226 kg/l, giving a material volume of 1.116 l.
B.3.2.3
Statistical Method
The packing fraction approach is generally useful only when the bulk density is known. The bulk
density is easily determined if the container is full, but a partially full container makes the
situation more complicated
because of lack of
0.9
knowledge about the volume
0.8
of material. In principle, a
0.7
series of density
0.6
Calcined @ 950
Calcined @ 800
measurements could be
0.5
600, then 950
0.4
Estimated
made to develop a statistical
Bounding
0.3
model of the powder, and
0.2
from that the appropriate
0.1
density could be determined.
0
0
1
2
3
4
5
6
7
8
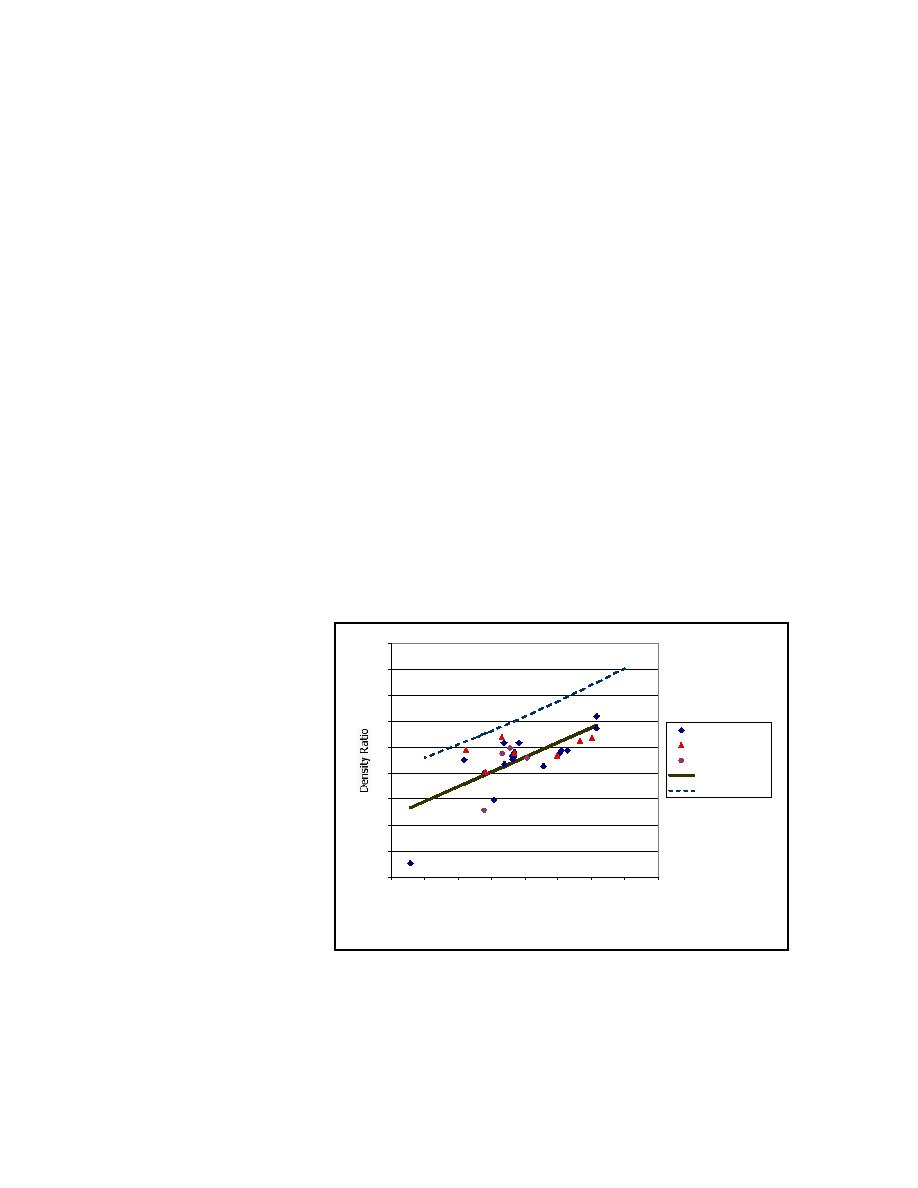
For example, Figure B-2
Bulk Density, kg/l
shows the ratio of bulk
Figure B-2. Statistical model of material density relationship
density to pycnometer
density as a function of bulk density for the materials in the "shelf life" program. The ratios
include material calcined at 950C, 800C, and some that was calcined first at 600C, and then
59
|
|
Privacy Statement - Press Release - Copyright Information. - Contact Us |
