 |
|||
|
|
|||
|
Page Title:
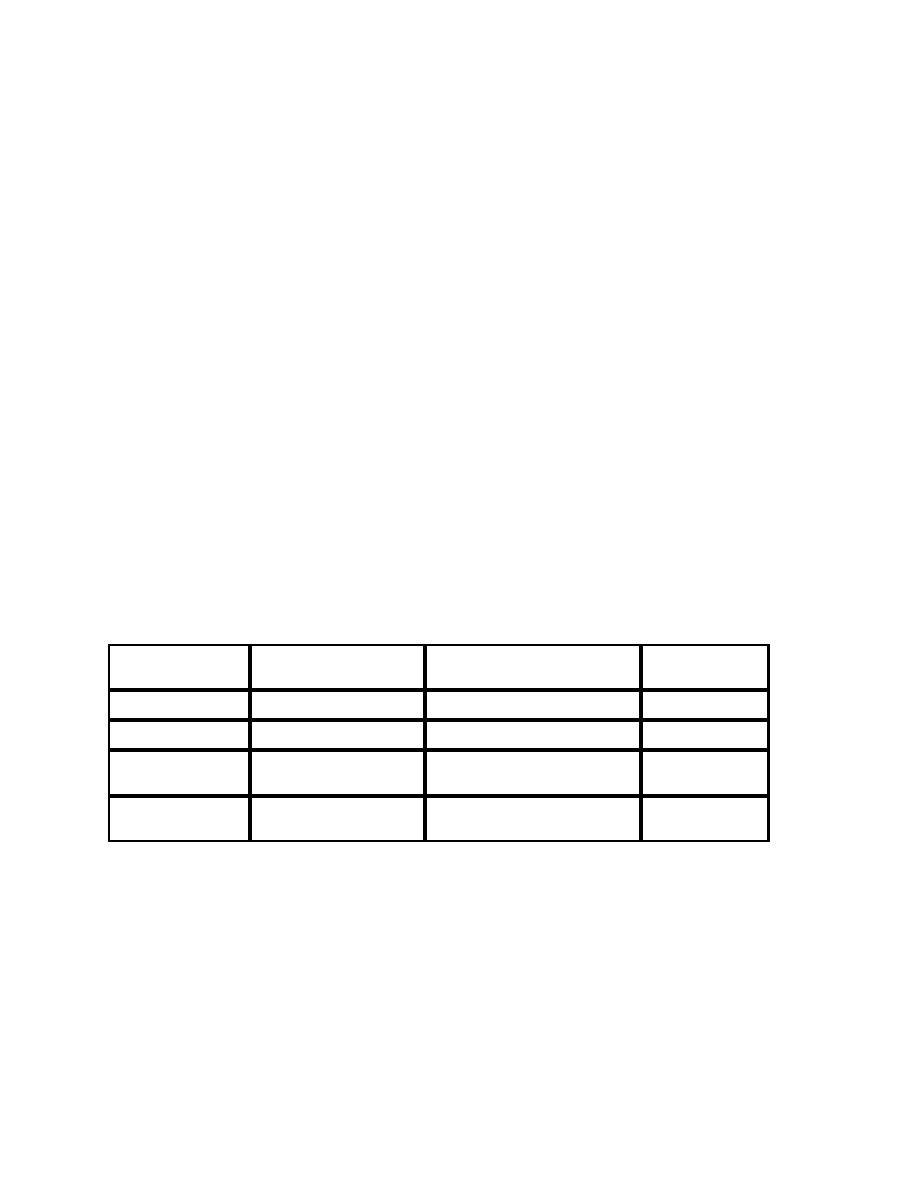
Table C-3Seismic Performance Goals & Specified Seismic Hazard Probabilities |
|
||
| ||||||||||
|
|  DOE-STD-1020-2002
Code and for all intent and purposes the exact numerical values have no practical
significance. The numerical values for PC 1 and PC 2 are no longer exact for the seismic
provisions of the IBC 2000 which primarily intends to provide uniform margin of collapse
for PC 1 SSCs throughout the United States.
The required degree of conservatism in the deterministic acceptance criteria is a function
of the specified risk reduction ratio. Table C-3 provides a set of seismic hazard exceedance
probabilities, PH and risk reduction ratios, RR for Performance Categories 1 through 4 required to
achieve the seismic performance goals specified in Table C-1. Note that Table C-3 follows the
philosophy of:
Annual seismic hazard exceedance of 4 x 10⁻⁴ (generally) based on IBC2000 for PC-1
1)
and PC-2, and PC-3 but 1 x 10⁻⁴ for PC-4.
2)
gradual reduction in hazard annual exceedance probability of other natural
phenomena hazards.
3)
gradual increase in conservatism of evaluation procedure as one goes from
Performance Category 1 to Performance Category 4 (PC 1 to PC 4).
Table C-3Seismic Performance Goals & Specified Seismic Hazard Probabilities
Performance
Target Seismic
Seismic Hazard
Risk Reduction
Category
Performance Goal, PF
Exceedance Probability, PH
Ratio, RR
1
**
*
2
**
*
4x10-4*
4
1x10⁻⁴
3
(1x10⁻³)1
(10)1
1x10⁻⁴
10
-5
4
1x10
(2x10⁻⁴)1
(20)1
*
The seismic exceedence probability is based on USGS maps generated in 1997 (and
included in IBC 2000) for 2% exceedence probabiity in 50 years. PH = 4x10⁻⁴
(Generally). Supplement by deterministic ground motions near very active faults.
**
The design methodology of the IBC 2000 for Seismic Use Groups I and III achieves
approximately performance goals of PC-1 & PC-2 respectively though it does not meet
the relationship shown in equation C-1 for the seismic provisions.
1
For sites such as LLNL, SNL-Livermore, SLAC, LBNL, and ETEC which are near
tectonic plate boundaries.
C-6
|
|
Privacy Statement - Press Release - Copyright Information. - Contact Us |